The Market
Our market
Demand for Aggreko's services is created by events: our customers generally turn to us when something happens which means they need power or temperature control quickly, or for a short period of time. Events that stimulate demand range from the very large and infrequent to the small and recurrent.
Examples of high-value, infrequent events or situations we have worked on include:
- Large-scale power shortage – Japan, Bangladesh, Argentina.
- Major sporting occasions – Olympic Games, FIFA World Cup, Asian Games.
- Entertainment and broadcasting – Glastonbury, Ryder Cup.
- Natural disasters – Hurricane Sandy in North America in 2012, Brisbane floods 2011.
- Post-conflict re-construction – Congo, Iraq and Afghanistan.
Examples of lower-value, more frequent events on which we might work are:
- An oil refinery needs additional cooling during the summer to maintain production throughput.
- A glass manufacturer suffers a breakdown in its plant and needs power while its own equipment is being repaired.
- A city centre needs chillers to create an ice-rink for the Christmas period.
How big is the market, and what is our share?
Because we operate in very specific niches of the rental market – power, temperature control and, in North America only, oil-free compressed air – and across a very broad geography, it is very difficult to determine with any accuracy the size of our market. A complicating fact is that our own activities serve to create market demand – Bangladesh and Indonesia did not figure highly in our estimates of market size a few years ago, but they are now important customers as a result of our sales efforts. Furthermore, our market is event driven, and major events such as hurricanes in North America, the Olympic Games, or major droughts in Africa can influence local market size in the short-term.
We have tried all sorts of ways to size the market for the Local business. In large and mature markets this is difficult, but not impossible. We can seek to track down every competitor and guess how much they have on rent as opposed to us. In emerging markets, where we are growing fastest, estimating market size is not difficult, it is impossible, as we are often the only major player in the market and the job we do is one of demand creation. Until we arrived in, say, South Africa, there was no market for industrial-scale temperature-control rental, because nobody offered it. Now there is one, because we do. So our approach is what expensive (and therefore, presumably, clever) consultants tell us is called 'market potential estimation', which works as follows:
- Step One: in a market (say, oil-refining in the US) in which we are well-established and have high market share, calculate our rental revenues (a known number) in the sector as a proportion of the total economic output of oil refineries in the US (another known number). This produces a very small number, like 0.00001.
- Step Two: make the bold assumption that if we can achieve, say, 0.00001 of the economic output of refineries in the US as revenues, we should, in theory, be able to achieve the same in oil refineries everywhere else. Therefore if we take the total economic output of oil refineries in, say China, and then apply the same multiple to that which we achieve in the US, that tells us how big the potential market is, and how little we have, so far, achieved in our attempts to penetrate Chinese oil-refineries.
- Step Three: take this same technique, and apply it to about 20 segments in 30 countries, and, hey presto, we have a number for the market potential (a dodgy number) and a number for our revenues in the sector (a known number), and therefore an estimate of our share of 'market potential'.
This is all a bit flimsy but, absent spending a fortune of our shareholders' money on consultants, it is the best that we can come up with and, actually, and most importantly, it is a useful technique for our salespeople because it tells us pretty accurately which markets and sectors we should be concentrating our efforts on.
From this process, we have come to the following conclusions:
- The Local 'market potential' is estimated to be about £4 billion; against our Local business revenues of £905 million, that would imply we have a share of the market potential of about 20%. Since a significant proportion of that market potential is not actually translated into demand, we guess that our worldwide market share is around 25%.
- In almost every country we operate in, we are the number one or number two player, and we are the only competitor that operates in all major regions of the world.
- The Local business market is growing at about twice the rate of GDP, and probably faster than that in some emerging countries where the market barely existed before we turned up.
Estimating market size is easier in the Power Projects business because there are few competitors, and we get reasonable intelligence about their activities. We keep a database of all known power projects, and estimate that the total market for Power Projects was about 8,400MW +/–10%. Our average MW on hire in 2012 was 3,794MW, which says that our market share is around 45%.
What drives growth in the Local business?
Growth in Aggreko's Local business is driven by three main factors:
- GDP – as an economy grows, so does demand for energy in general, and rental equipment in particular. When economies are growing fast, businesses tend to be busy, and they are therefore more likely to rent power equipment for a weekend to do necessary maintenance, rather than lose production. In slow-growing economies where there is excess capacity, the reverse is true.
- Propensity to rent – how inclined people are to rent rather than buy. This is driven by issues such as the tax treatment of capital assets and the growing awareness and acceptance of outsourcing. In emerging markets, financing is hard to come by and often exorbitantly expensive, and they are therefore more likely to be prepared to rent.
- Events – high-value/low-frequency events change the size of a market, although only temporarily. For example, Hurricane Sandy in 2012 led to a short-term surge in temporary power demand in the areas affected by the disaster; likewise, the London Olympics in 2012 vastly increased the market for power rental in the UK, but for six months only.
In the last five years, real global GDP has grown by around 1.7%; so we would assume that the market potential grew by around 3.4% in real terms. During the period, our revenues in the Local business grew by 15% in nominal terms, and by 10% in constant currency terms. So we believe our market share grew during the period.
What drives growth in the Power Projects business?
The factors which drive the growth of our Power Projects business are different. The main trigger of demand is power cuts; when the lights go out in a country, people want power restored as quickly as possible. It is a perverse fact that people value power most when they are without it. We believe that in many parts of the world, and most particularly in many developing countries, there will be increasing numbers of power cuts, caused by a combination of burgeoning demand for power, ageing existing plant and inadequate investment in new capacity.
Our core market for Power Projects is in emerging markets where GDP is growing fast, and demand for power is growing faster than GDP. Working with a leading group of professional economists at Oxford Economics, we have built a model which takes data on GDP and population growth, power consumption and power generation capacity for 170 countries over the last 10 years. Using this historical data, it then projects future power demand based on forecasts of population and GDP growth. Our model predicts that worldwide demand for power will grow by around 4% per annum between 2010 and 2020, comprising around 6% in non-OECD countries and 2% in OECD countries. Our model reflects the sharp divergence between the growth in power consumption between OECD and non-OECD countries in recent years, as shown in the graph below.
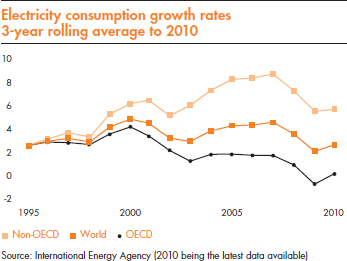
The rapid growth in power consumption in developing countries is driven by industrialisation, urbanisation and by the growing number of consumers having access to devices which consume electricity, such as fridges, televisions and mobile phones. Between 2000 and 2010, the number of people whose power consumption per capita was growing faster than per capita GDP increased by nearly 1 billion to over 3 billion souls (source Oxford Economics). And, according to the International Energy Agency, there are still over 1.3 billion people with no access to electricity. This is not through lack of wanting.
To make this situation worse, by 2015, 20%-25% of the world's installed power-generating capacity will be over 40 years old, which we believe is a reasonable proxy for the average life of a permanent power plant. The coming years will see the beginning of a replacement cycle during which a large part of existing power-plant construction capacity will be dedicated to replacing existing plants in North America and Europe, rather than building replacement or additional capacity in developing countries. The sums which need to be mobilised over the next 10 years to re-build the power distribution and generation capacity in North America and Europe are huge; in the UK alone, the regulator estimates that up to £200 billion will be required. This means that developing countries will have to compete for funds with developed countries, where investment risk is perceived to be far lower.
We have recently updated our current models of the gap between supply and demand, and we now believe that the combination of these demand-side and supply-side factors will increase the worldwide shortfall of power generating capacity to around 230 gigawatts (GW) by 2020 which is a nearly 4-fold increase from 2005 when it was about 53GW. In our core market, which we define as non-OECD countries excluding China, we estimate that in the same period the shortfall will increase 9-fold, from 22GW to 195GW. The ultimate size of the shortfall will depend on both the rate of increase in demand and the net additional generation and transmission capacity brought into production during the period. Even if the shortfall is lower than our current forecasts, it will still represent a level of global power shortage significantly larger than today's. We are confident that such a level of power shortage will drive powerful growth over the medium and long term in demand for temporary power as countries struggle to keep the lights on.
Health Warnings
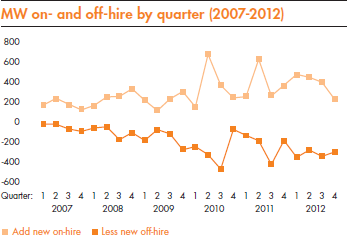
Our Power Projects business has delivered fantastic returns over the last two strategy cycles: a compound growth of 34% in trading profit and an average return on capital of 31%. Because the structural drivers of growth are so strong, it is easy to be seduced into the belief that progress has always been smooth. This is not the case: not only has order intake been volatile, but we have also seen large variations in quarterly on- and off-hire rates (see graph below). In a business where customers pay a premium for the ability to take on or get rid of capacity at short notice, we should not be surprised if they exercise their rights for their convenience rather than ours, and it therefore the case that growth in our Power Projects is subject to fits and starts rather than one of smooth progression. The structural growth drivers will ensure that, over time, the direction will be onwards and upwards but, from quarter to quarter and from year to year, it will not be a smooth ride.
It is also important to remember that Power Projects specialises in providing energy infrastructure in countries where political and commercial risk is high – sometimes very high – and the fact is that we do business where others fear to tread. To date, we have never had a material loss of equipment or receivables but it is likely, that sooner or later, one of our customers will misbehave. Our assets are at much greater risk of loss or impairment than they would be if they were sitting in the suburbs of London or New York or Singapore. We have extensive risk-mitigation procedures and techniques, and we are currently carrying over $80 million of bad-debt provisions, but investors should remember that the returns we report are fundamentally 'risk-unadjusted rates of return' because nobody has yet behaved badly enough to adjust them.